
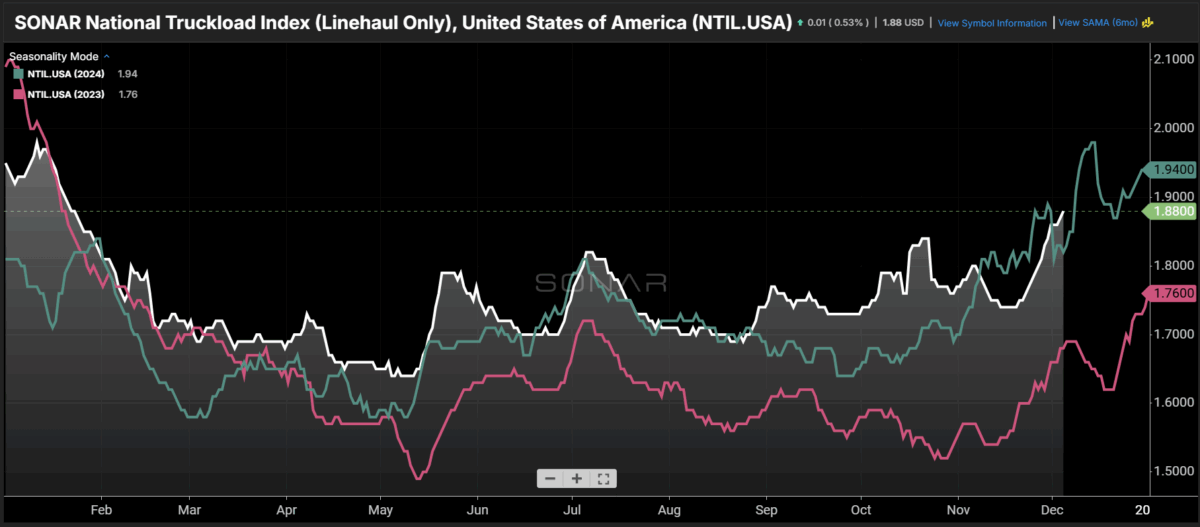
Chart of the week: National Truckload Index (Linehaul Only) – US Sonar: NTIL.USA
The truckload spot rate excluding estimated fuel cost (NTIL) rose 8 percent during the two-week period from Nov. 19 to Dec. 4. The increase was slightly sharper than two years ago, which saw slower but similar-sized moves over the Thanksgiving holiday. Sudden and drastic rate jumps have been one of the characteristics of the truck market this year. While the market was expected to enter a more balanced phase in 2025, it is instead stuck in a sort of limbo, offering only brief relief for many transport providers. What does this signal indicate for the coming year?
Spot rates are not a perfect measure of the truckload market, but they are very effective in reflecting how companies perceive the value of their services. For most of the past three years, operators have had little reason to feel more valued as capacity has consistently outstripped what the market can absorb.
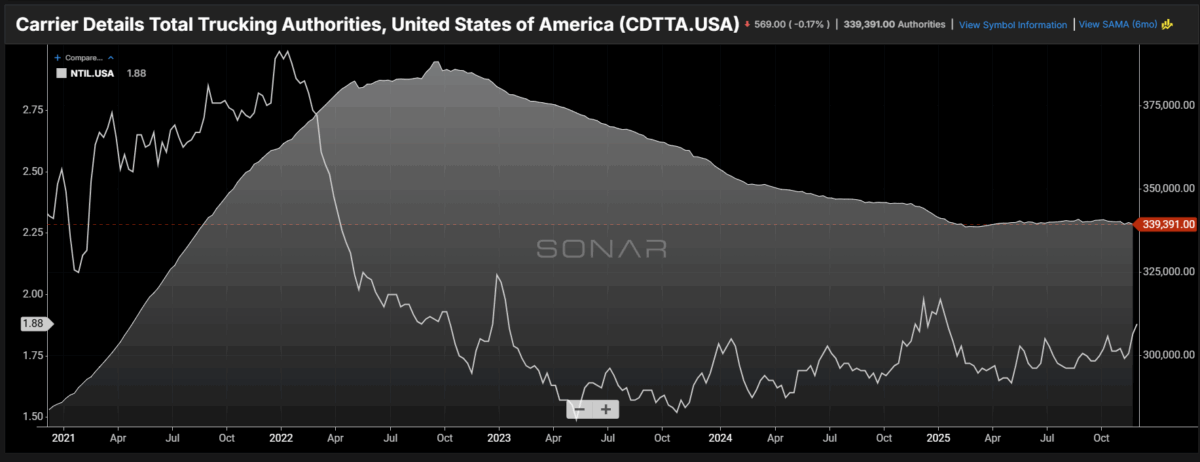
According to a Carrier Details analysis of FMCSA data, more than 100,000 new motor carriers were issued from fiscal authorities in 2021-2022. After demand returned to more “normal” levels, the market found itself with a significant excess capacity – capacity that has been slowly declining since early 2023, with a reduction of approximately 50,000 incumbents.
The recent increase in regulatory pressure on English language proficiency (ELP) and indirect CDL issuance has had some effect, but this effect has been difficult to quantify. The most visible effect came in October, when it was reported that a Serbian news article prompted many Eastern European operators – both compliant and non-compliant – to temporarily stop driving, causing a slight increase in spot rates. Rates had mostly normalized by mid-November.

Capacity withdrawal is also hidden by weakening demand. According to the newly released SONAR Truckload Volume Index (STVI), truckload tender volume — shippers’ electronic requests for capacity — has fallen 5 to 10 percent since mid-February compared to last year. An unexpected drop in demand appears to be the main reason the market has stopped pulling out of a long-term transportation slump. Surprisingly, however, it has not materially worsened the situation.
At this time last year, NTIL showed a more gradual and sustained uptrend that started in late October and accelerated in early November – earlier than a typical season would suggest. Many interpreted this as a sign of a more durable market recovery outside of normal seasonal pressure.
This year, instead of a steady movement, rates are characterized by sharper and more sudden increases. This pattern shows that carriers are reluctant to raise rates until it’s clear that they should or can.
This uncertainty may mask a tighter underlying market than the headlines suggest. This could set the stage for more volatility next year.
Winter weather has also played a role in the past two years and could once again take operators offline and disrupt networks, even if demand remains weak. Spot rates show that carriers are increasingly unwilling to operate in unsound conditions at current price levels.
About the weekly chart
The FreightWaves weekly chart is a selected chart from SONAR that provides an interesting data to describe the state of the freight markets. A chart is selected from thousands of potential charts in SONAR to help participants visualize the shipping market in real time. Every week a market expert posts a chart with commentary live on the front page. The weekly chart will then be archived on FreightWaves.com for future reference.
SONAR collects data from hundreds of sources, presents the data in charts and maps, and provides real-time explanations of what transportation market experts want to know about the industry.
The post Rising truck rates tell us something appeared first on FreightWaves.